

Continuing from the layer perspective and the house level view, here I played with the street level view. Inspiration:

My brief: For the street level, let’s explore taking a OpenStreetMap view of a street, and then converting it from the top down map view, to the idealised, hand drawn version with inputs and outputs.
Claude suggested the workflow:
- Pull real geometry from OpenStreetMap — via the Overpass API, get building footprints, road centerlines, and (if available) water/sewer infrastructure tags for a specific street. This gives exact polygons, not a sketch yet.
- Simplify — run your existing Douglas-Peucker approach on the building footprints to reduce them to a handful of vertices each, similar to what you did with ward boundaries. This is the “idealized” step — real proportions, but simplified geometry.
- Stylize — convert the simplified straight-edge polygons into the hand-drawn language we’ve been developing: wobble injection along edges, rough/retraced strokes, corner treatment, and for each building, an isolated element (id +
data-flow) so it can carry inputs/outputs, the way the house fixtures do. - Wire flows — road becomes the “trunk” connector; each building’s outlet ties into it, mirroring the
street-outlet/street-inletnodes we already defined at the house level. This is where the house-level SVG’s connector nodes actually get consumed.
However, this gave me the wrong view. This was also using my friends’ street in Oroe, and … there’s not a lot of people living there, haha, so this wasn’t so useful. Although I guess pretty in its own way.
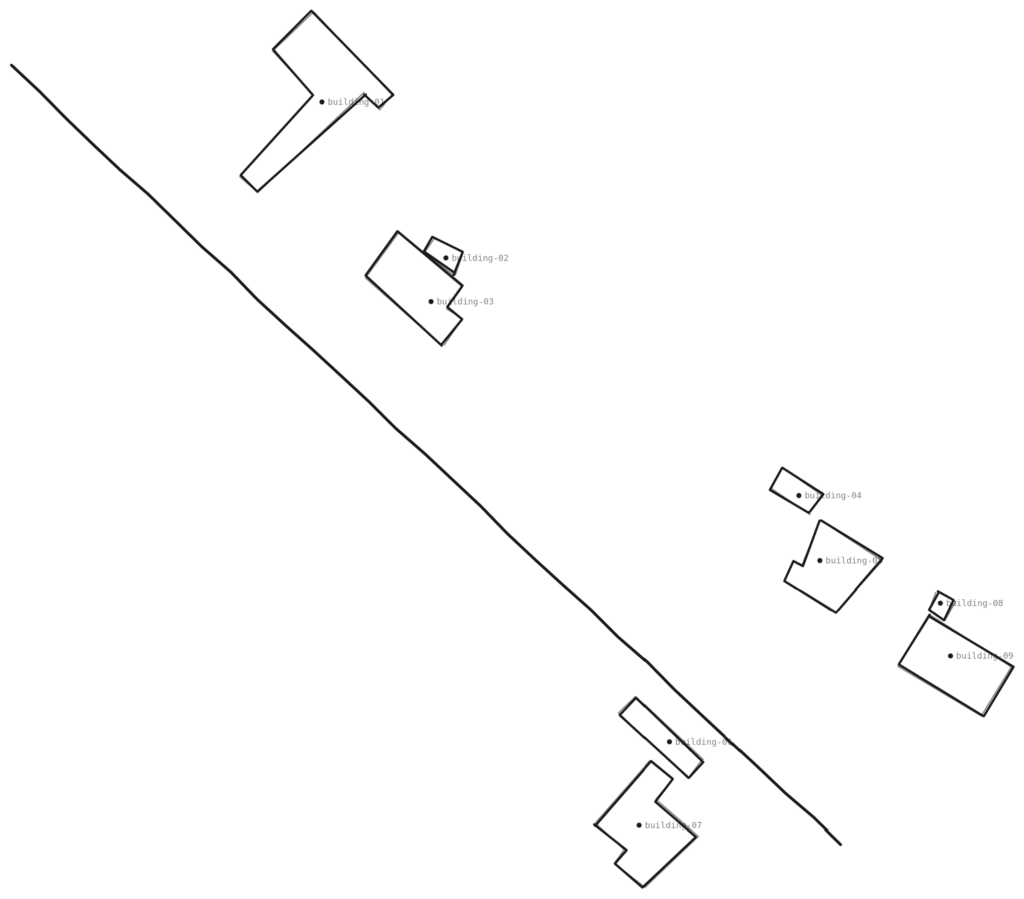
I want something like imagine if you are standing some distance away looking at all the houses on this street, not looking at them top down, which Claude says is the “elevation take”.
It did a few things, that we may or may not choose to use if we follow this tool idea:
- Horizontal position = real position along the street (arc-length from the OSM road geometry), so the left-to-right rhythm and spacing between houses is genuine, not invented.
- Building width = real footprint width, projected onto the road’s tangent direction — so a 19m building reads wider than a 4m shed.
- Height is fabricated — OSM has no
building:heightorbuilding:levelstags for any of these nine, so I derived a gable silhouette proportionally from each building’s width (wider footprint → taller gesture) rather than true height data. Worth flagging clearly since it’s the one dimension not grounded in the source data. - Depth/perspective cue — buildings set further back from the road (real
distvalue, 6.8m to 39m) are drawn smaller, higher up, and slightly more transparent, so the ones right on the street read as “near you” and the set-back cottages recede — a simple depth layering rather than true perspective projection, but it gives the “standing at a distance” read you’re after. - Structure: a single wobbly ground/street line at the base, each building as its own
<g id="building-01">…with a dashed connector down to aflow-nodeon the ground line — same isolation pattern as the house and plan-view street drawings, so it’s still wireable.
It asked about building overlap, if that needs to be forced separate. I like the overlap but we can see how this goes. For the height, and individual house character, or, well, anything really, it would be great if users can play with their street to make it really look like theirs.
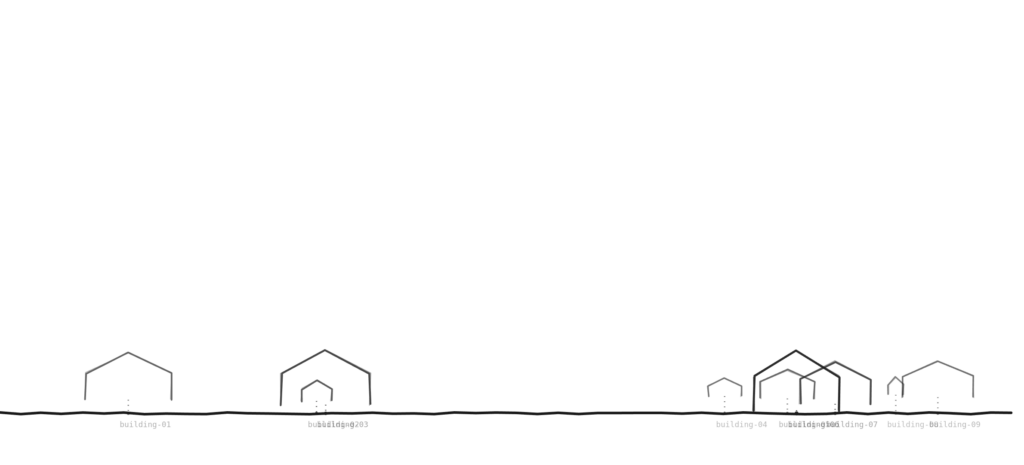
The svg has connector things for the water flows, just keep that in the back of mind for now.
So next I really wanted to add the topography, to see how the water flows, eventually (and I just have a thing about topography). Two problems. The example is in Denmark. It’s flat. So I started working with Kamberler Parkı area in Bursa, Turkey. The second problem is that Claude can’t get the topography sorted. Something we need to fix in the tool. I don’t know if this is an AI problem, with sites blocking it, or a problem with the topography website, or what exactly. For now, we worked with a illustrative placeholder slope.
What the technique now does:
- The ground line is no longer flat — it’s a wobbly hand-drawn curve following the (placeholder) elevation, with light dashed reference lines and elevation labels down the left, in the spirit of a real topographic profile sketch.
- Each building sits on the ground line at its own local elevation — so as the street “descends,” the row of buildings actually steps down with it, rather than floating on a flat baseline. Buildings also still recede slightly by depth cue, same as the Denmark version.
- Vertical exaggeration is applied (elevation changes are stretched ~4× relative to horizontal distance) — standard practice for topographic profile sketches, since real-world grades are usually too subtle to read at 1:1 scale.
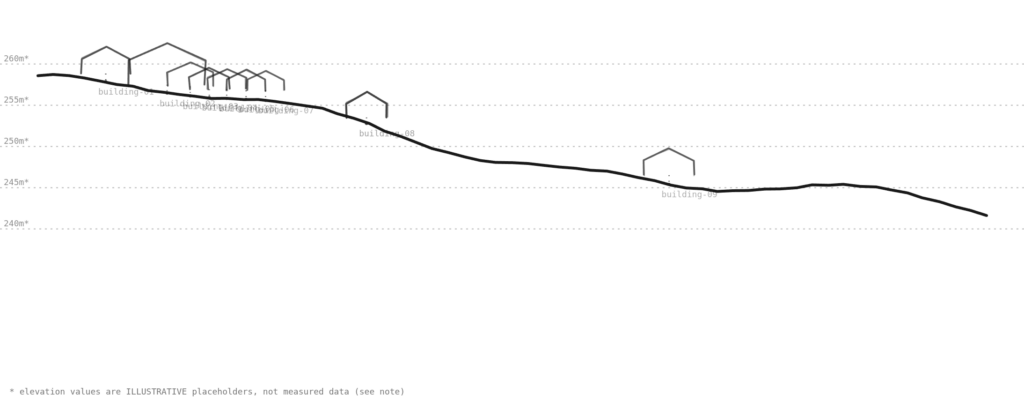
I love this so much I may just get it tattooed.
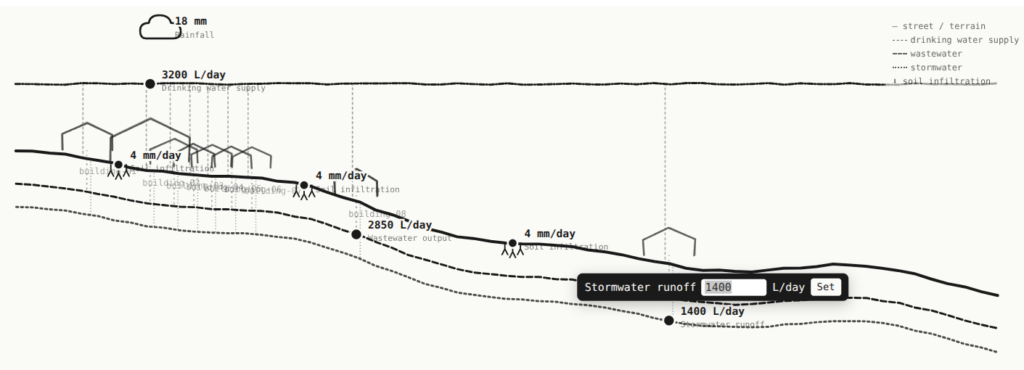
Next, I wanted to start looking at visualising the flows. Brief: I want the urban resource flows indicated on this view – drinking water supply, wastewater infrastructure, stormwater infrastructure, soil penetration, whatever else indicated in stylised form. I need the input and output values indicated, and with some level of input from the user, in the same way that the cloud can get clicked on and then update the sankey.
See the interactive thing below, along with the code to download and a screenshot incase something isn’t working. HOW COOL IS THIS!
screenshot incase the above doesn’t work:
What it does:
- Five flow types, stylized as separate line qualities rather than color, since we’re keeping color parked: drinking water supply runs as a dash-dot line above the street (pressurized, so it doesn’t follow terrain the way gravity systems do); wastewater and stormwater are two separate lines below the street, both following your placeholder terrain profile since they’re gravity-fed; soil infiltration is a small set of downward arrow-glyphs sitting in the gaps between buildings, where ground is unpaved/permeable.
- Every building connects to all three pipe systems via short dashed ties (supply in from above, wastewater and stormwater out below) — visually establishing that each house is a node with multiple simultaneous flows, not just one pipe.
- Click any node → popover → type a value → it commits. On commit it does two things, mirroring what you described from the rain/Sankey block: writes to
localStorageunder astreetFlow::gokdere-segment-01::<nodeId>key, and dispatcheswindow.dispatchEvent(new CustomEvent('streetFlowUpdate', {...}))with{nodeId, nodeType, value, unit, segment}. A Sankey block listening for that event on the same page would pick it up exactly the way your rain block currently does. - Right now only the aggregate street-level nodes (cloud, supply main, wastewater main, stormwater main, three infiltration points) are interactive — not per-building. That’s a deliberate scope cut for this pass, not a limitation of the structure; each building’s connector already has a stable id (
building-01etc.) so per-building interactivity is additive, not a rebuild. – in theory individual users could add their buildings’ data to their street, or we use an averafge value or whatever.
So this raises some questions about the “Value semantics” – where do these values come from? What guides them?
Right now these are just raw numbers a user types in. Should some be computed instead (e.g., wastewater ≈ some fraction of supply, stormwater ≈ rainfall × impervious area) so the diagram enforces a mass-balance relationship rather than accepting arbitrary independent inputs?
This is the real value of the tool as a boundary object, in my opinion.
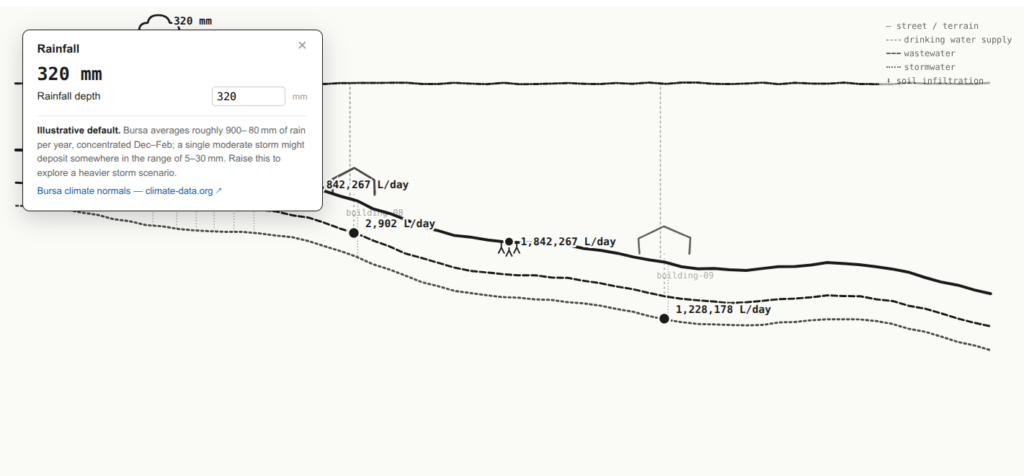
What I said next: The objective is indeed to show the mass-balance relationship, but then also to play with this and explore different scenarios. I imagine a larger block opening when you click on the dot, starting with your existing input lines. Below that a short description of what the expected range of values would be, along with the hyperlinked references sothat the user can investigate it. Check it out, download the code, screenshot as back up:
What’s actually driving the numbers:
- Supply, wastewater, stormwater, and infiltration are all computed, not typed in. Only their contributing parameters are editable. Change the runoff coefficient or rainfall and stormwater recalculates live; change supply’s inputs and wastewater — which is derived from supply — updates too. That’s the mass-balance chain you asked for: rainfall splits into stormwater + infiltration (a simplified complement, flagged as such), and wastewater is a fraction of supply, not an independent number.
- Every parameter panel shows: the computed/current value → the formula it came from → editable inputs → an expected-range note → a real hyperlinked reference. I pulled genuine sources for each: TUIK for household size, WHO for per-capita demand, a wastewater engineering text (von Sperling 2007) for the sewer return coefficient, FHWA’s HEC-22 for the runoff coefficient, EPA for typical residential imperviousness, and USDA NRCS for soil infiltration rates — all real, clickable, and worth spot-checking yourself since I’m summarizing, not quoting them directly.
- Two real numbers are already wired in: the 9-building count and 1,105 m² of building footprint both come straight from the OSM data, not assumptions. The road area (6m assumed width × real 375m segment length) and the rainfall depth are the two honestly-labeled placeholders — flagged in-panel rather than buried.
- Broadcast contract unchanged in spirit, richer in payload: every edit still writes to
localStorageand dispatchesstreetFlowUpdate, now carrying the full parameter set and the computed snapshot ({params, computed}), so a connected Sankey block can either trust your computed totals or recompute its own view from the raw parameters.
Now my first thought on this was, wow. Second was, it’s rather complicated. It’s getting to be a proper engineering model. Then Claude said, this is a genuinely simplified water balance (no evapotranspiration, no leakage losses, no seasonal variation) and I had to scurry back to my notes to add these terms in my water flows list, haha. But yeah, Claude said it’s good enough for exploring scenarios and seeing relationships move together, not a substitute for an actual hydrological model, and I thought it’s getting a bit heavy already.
The tradeoff of the desire to show more information while being limited in not trying to be a professional hydrological model is tricky. I was also worried that a lot of things felt hidden. So then I started thinking about displaying the Sankey. To really show what is computed and where the values come from? In other words, it visualises the supply, wastewater, stormwater, and infiltration flows, and shows the explicit links with the computed/current value → the formula it came from → editable inputs, and then the expected-range note and a real hyperlinked reference pop up when you hover over the value.
And then I wondered, what do people DO with this? So I asked to also add local water storage, like plastic tanks or ponds along with user-input storage values, and how many days of water this is or something like that.
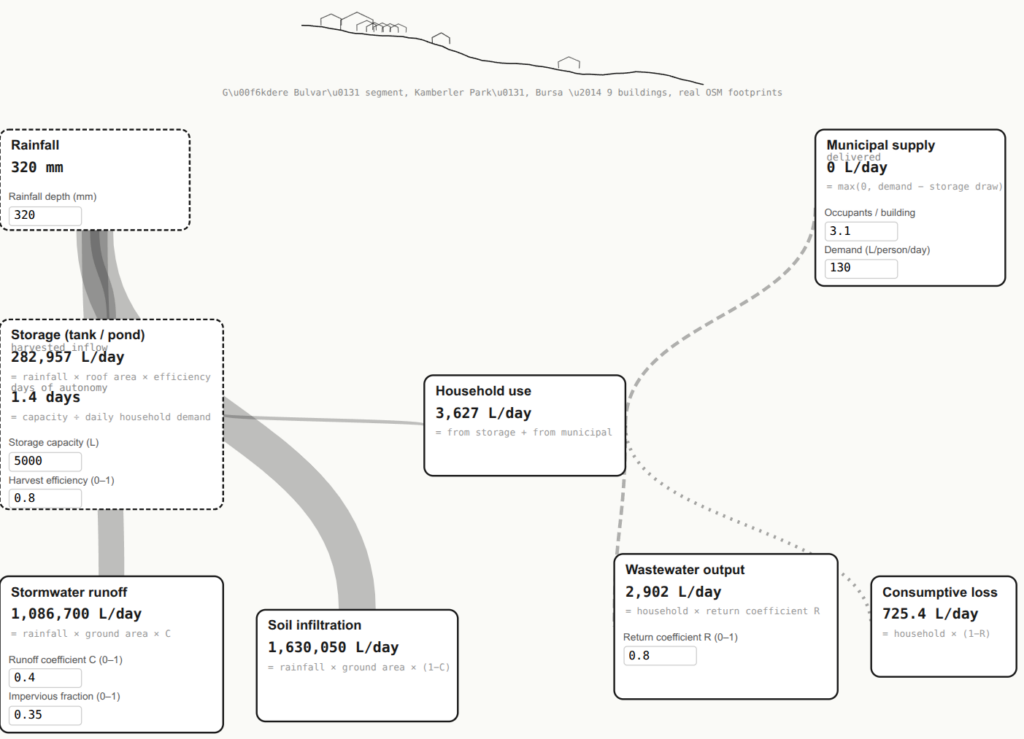
The hilarious thing, that I have no idea if it would be true or not, is that harvesting the rain on these roofs give enough water to the people living there. This is probably assuming good rains, not a drought, and then you still have to clean it … but this was a weird thing to see.
- Harvested inflow = rainfall × real roof area (1,105 m², from OSM) × harvesting efficiency — feeds the tank/pond.
- Household draws from storage first, municipal supply covers whatever’s left — so if you raise storage capacity or harvesting efficiency, you’ll watch the municipal-supply ribbon visibly shrink.
- Days of autonomy = capacity ÷ daily household demand — the “how long would this tank alone last” number you asked for, shown right on the storage node.
With the current defaults, harvested rainwater (8,842 L/day) exceeds total household demand (3,627 L/day), so municipal supply shows 0. That’s not a bug — it’s what happens when a rainfall value is treated as a daily-average input for harvesting, but a single 10mm event doesn’t happen every day. Two honest ways to fix this depending on what you want the diagram to answer:
- Treat rainfall as an event value — fine for asking “what happens on a rainy day,” but then harvested/stormwater/infiltration are event totals while supply/wastewater are daily averages, which are mismatched time bases sitting side by side.
- Switch to a long-run daily-average rainfall (Bursa’s ~893mm/year ÷ 365 ≈ 2.4mm/day) for a steady-state harvesting contribution instead — more honest for comparing against daily demand, but loses the “storm event” intuition.
These are things to discuss with the consortium about how to develop the tool.
At this point I started thinking about the global use of the tool again, and how this would all work if Claude doesn’t go and fetch everything. Where does the data come from, how does the guts of the thing work? For a start, up to now we used an example I specified and provided the .osm data for. Kamberler Parkı also isn’t just one street, the single street constraint is a bit annoying. So I wanted a selector tool. Brief: please include a way to select a street or curve (or multi-points, like the measure tool) in OpenStreetMap, as the first step, for the tool to then analise.
Workflow: Search for a place, click Draw path, click points along any street to trace it, Finish, then Analyze this path. Sadly, the topography is still lost.
Claude couldn’t test this, and I was pretty tired by now. But I think this is a really promising avenue, worth discussing with the consortium and making some choices, and then probably getting a proper coder to work on this.
We would have to think through where the data gets pulled from, Claude said “Overpass’s public instance can be slow or rate-limited for a busy prototype — fine for occasional testing, but your real tool should probably route through your own backend or a cached dataset rather than hitting overpass-api.de directly from every visitor’s browser.”. And what do we pull in from OSM? Right now it fetches buildings only, not the road itself — your drawn path is the road reference, which is actually more flexible (works for a path that doesn’t correspond to a single named OSM way) but means it won’t auto-snap to the actual street centerline.
I asked Claude to create a report, in case that’s useful.
All in all, I’m pretty chuffed. I think this is great inspiration.