

Carrying on from the Layered visualisation, I started playing with what a house level, or street level visualisation could look like. Some inspiration off the web:
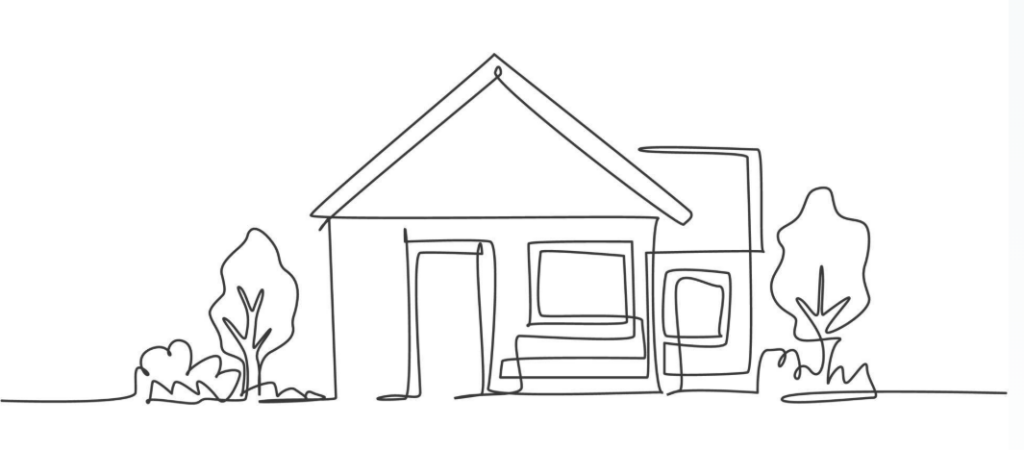
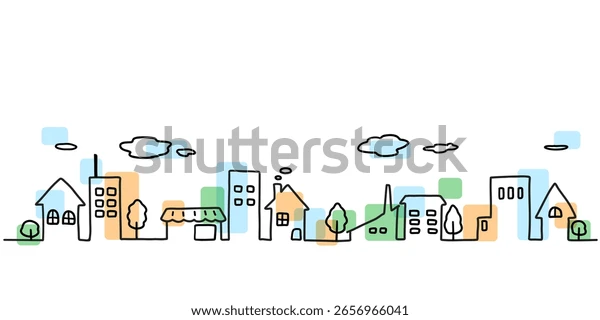
I particularly liked this image of the line drawing and then some colour boxes floating about. These boxes could contain information or things to interact with.
Claude was supportive (of course it is, it’s AI, trained to recognize psychological patterns within the messages and formulate the answer to both validate and challenge (Stela’s words)): That continuous-one-line style is very much in your “sculpting not surveying” wheelhouse, and it’s genuinely well-suited to what you need: single strokes read cleanly at small sizes, and you can break the line into discrete <path>/<g> elements with IDs so each one becomes a hook for your Sankey (roof → gutter → drain → sewer main → treatment works, etc.).
Claude made a mock-up, which sucked, but the idea is that the elements of the house is split out (roof, gutter, downspout, wall, window, door, drain-to-street). Flow elements are separated with data-flow attributes: roof-catchment → gutter → downspout → household-drain → street-connector. Each has an id you can document.querySelector or D3-select independently, and flow-node circles mark connection points (roof outlet, drain origin, street inlet) — these are the coordinates you’d match up against your Sankey’s node positions or use as anchor points for animated flow particles along the paths.
Styling is CSS-scoped under #house-layer so it won’t leak into your theme, and flow paths get a distinct default color/class so you can toggle them (e.g. highlight active flow, hide when the Sankey isn’t focused on household-level).
I added more “granularity” that a toilet, shower, kitchen tap shows up separately and each fixture had their own inlet and outlet node, to link to a Sankey.
I was struggling with what this could look like and asked “if the La Linea cartoon character had a house, how would it be displayed?” I also want a garden, a pond, an entrance road (aka hard surface) along with the house. The way I am thinking is that this layer becomes a single house in the street level. Maybe other users maybe has information for the other houses on the street, or we replicate the house values to become an aggregate value for the street, along with e.g. stormwater flows. So the water in and wastewater out connects to the street, I think. Then for the neighbourhood the streets aggregate, etc.
Claude says: Cavandoli’s whole gag was that the character is drawn with one continuous, thick, wobbly line and interacts with the world as a 2D silhouette. I like that approach as a light, artful approach to the visualisation tool.

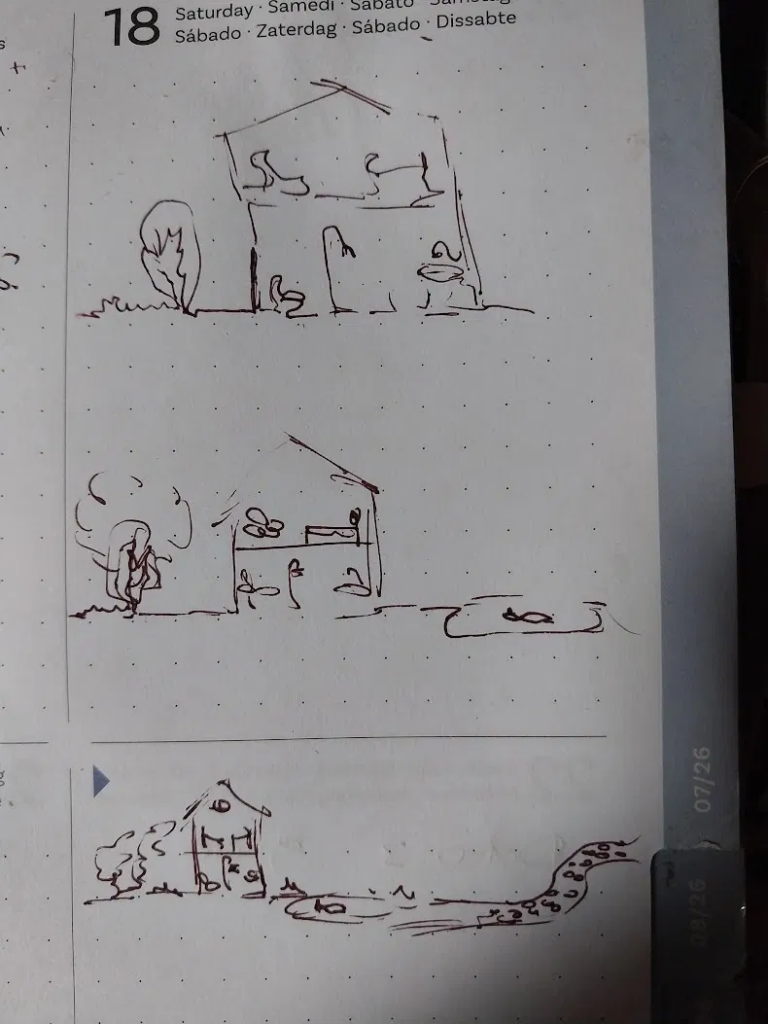
At this point I just got stuck, the visual was so damn ugly I couldn’t focus, but any attempts at my clumsy drawings didn’t do any better. The svg has links and stuff in the file, but WordPress wants nothing to do with it.
So I gave up on the house view and looked at the street instead:
One Reply to “AquaSavvy: House flow Sankey”